
JLL Reports Record Third-Quarter 2018 Results
Diluted EPS up 36 percent to $2.93; adjusted diluted EPS1 up 37 percent to $3.02
CHICAGO, November 6, 2018 — Jones Lang LaSalle Incorporated (NYSE: JLL) today reported strong operating performance for the third quarter of 2018.
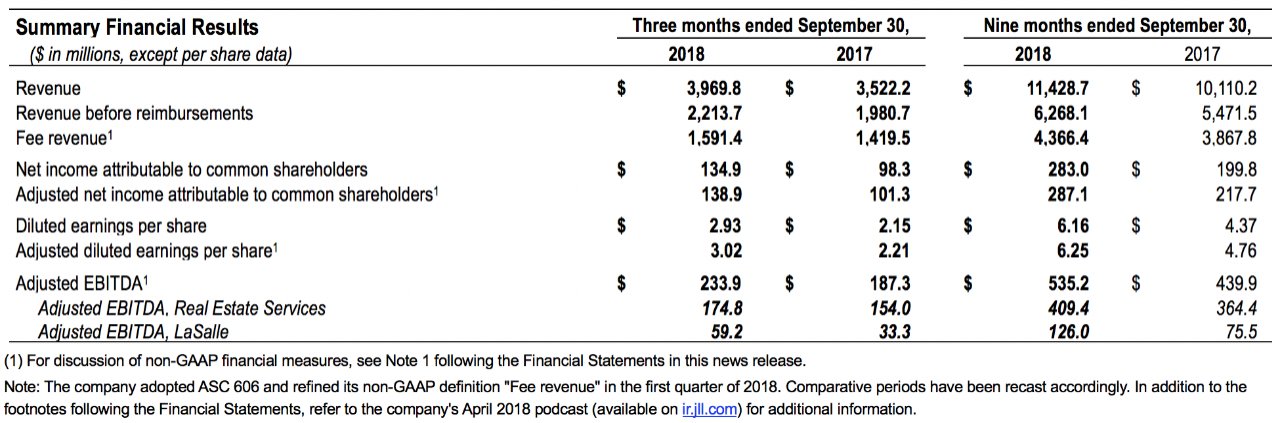
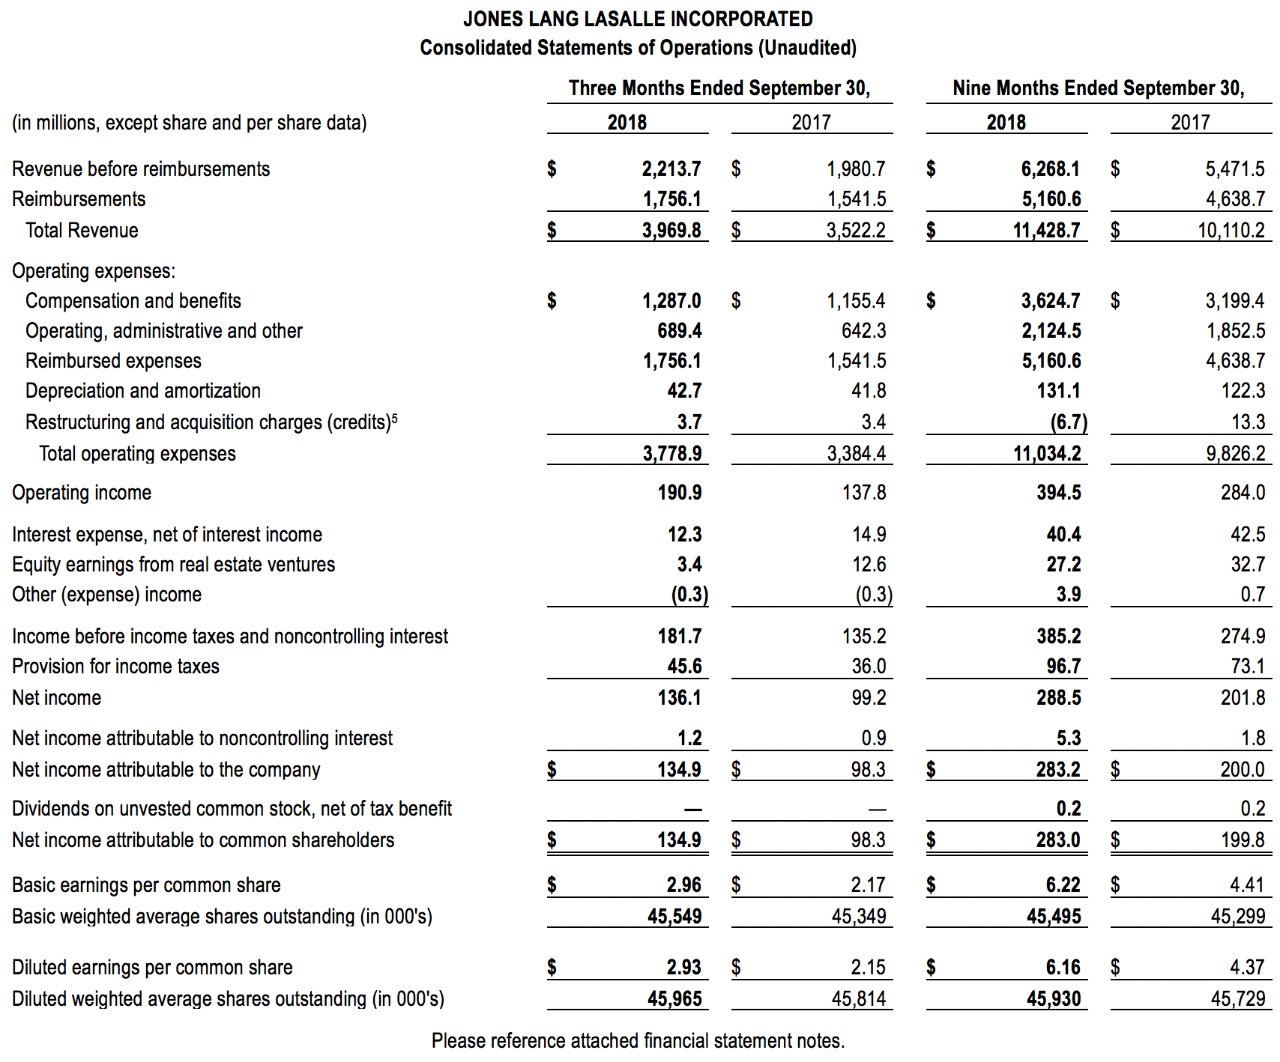
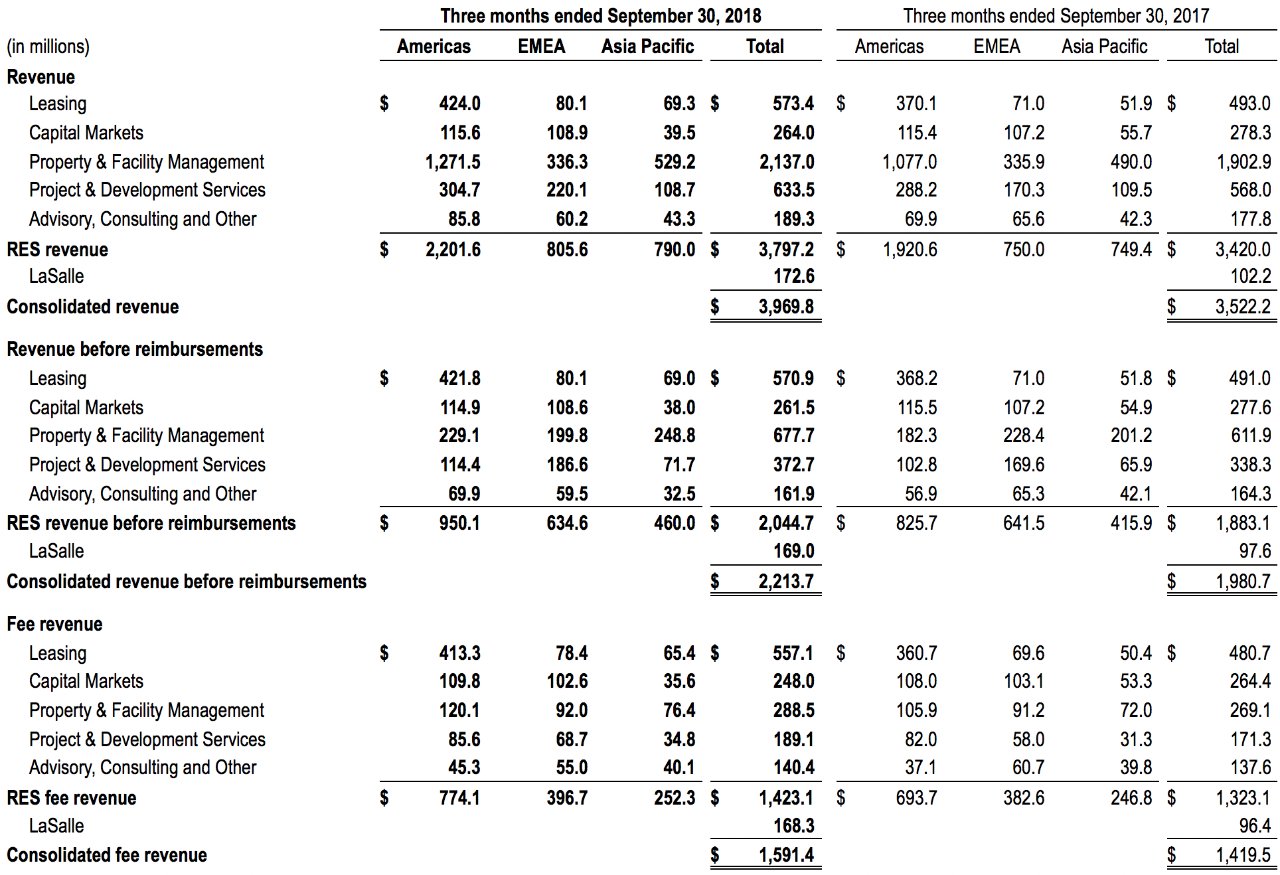
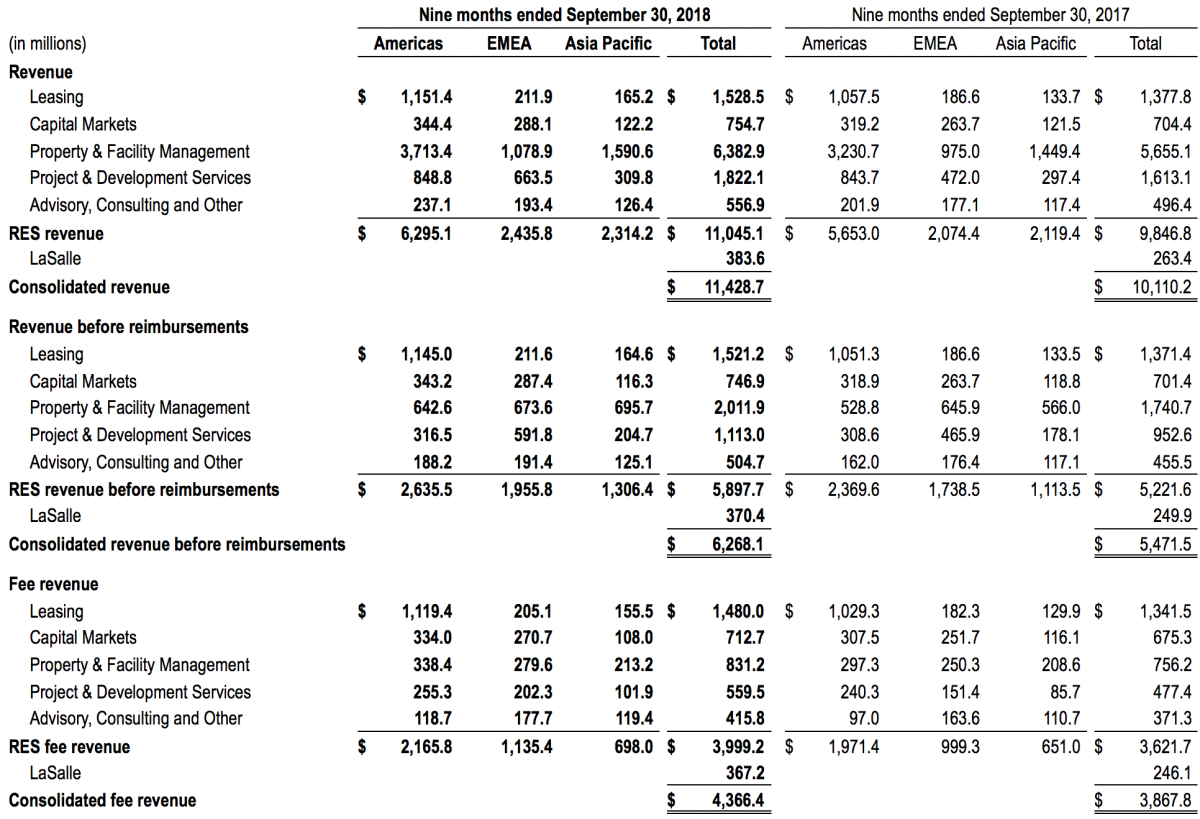
- Consolidated revenue up 13 percent to $4.0 billion; consolidated fee revenue1 up 12 percent to $1.6 billion
- Leasing, Corporate Solutions and LaSalle lead robust, double-digit consolidated organic revenue growth
- Americas performance, LaSalle incentive fees and EMEA improvement drive strong margin expansion
- LaSalle results highlight outstanding value generation on behalf of clients and continued profitable annuity revenue growth
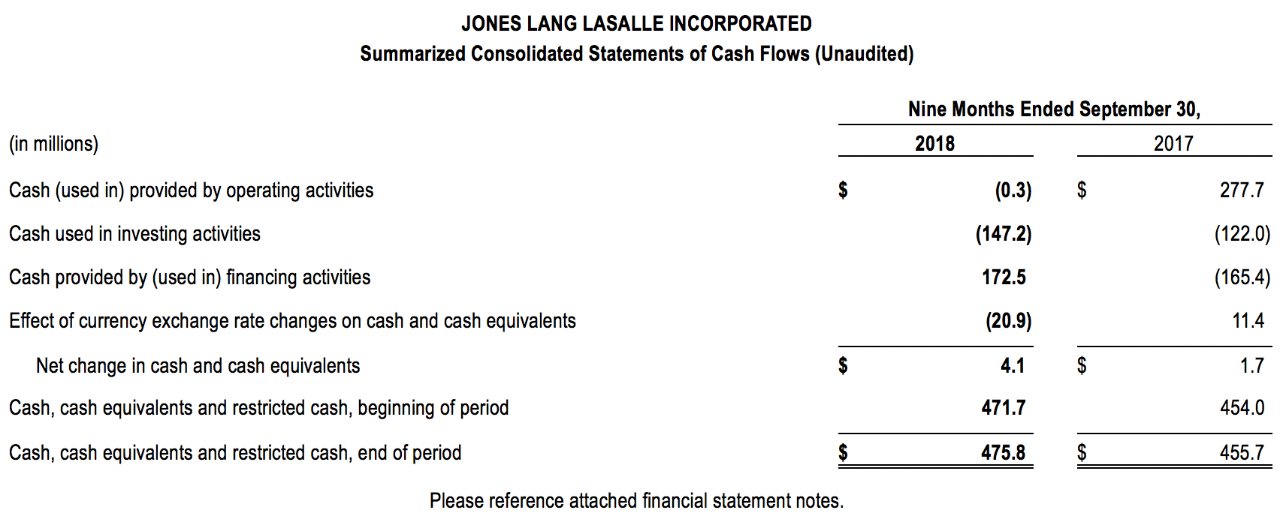
- Solid cash flow and disciplined working capital management drive net debt decrease
- Semi-annual dividend of $0.41 per share declared; total 2018 dividends up 14 percent over 2017
“Across JLL, we capitalized on strong business fundamentals and our operating strength to deliver record third-quarter performance,” said Christian Ulbrich, JLL CEO. “We head into the remainder of this year with positive momentum and confidence in achieving outstanding 2018 results.”
Consolidated Third-Quarter 2018 Performance Highlights:
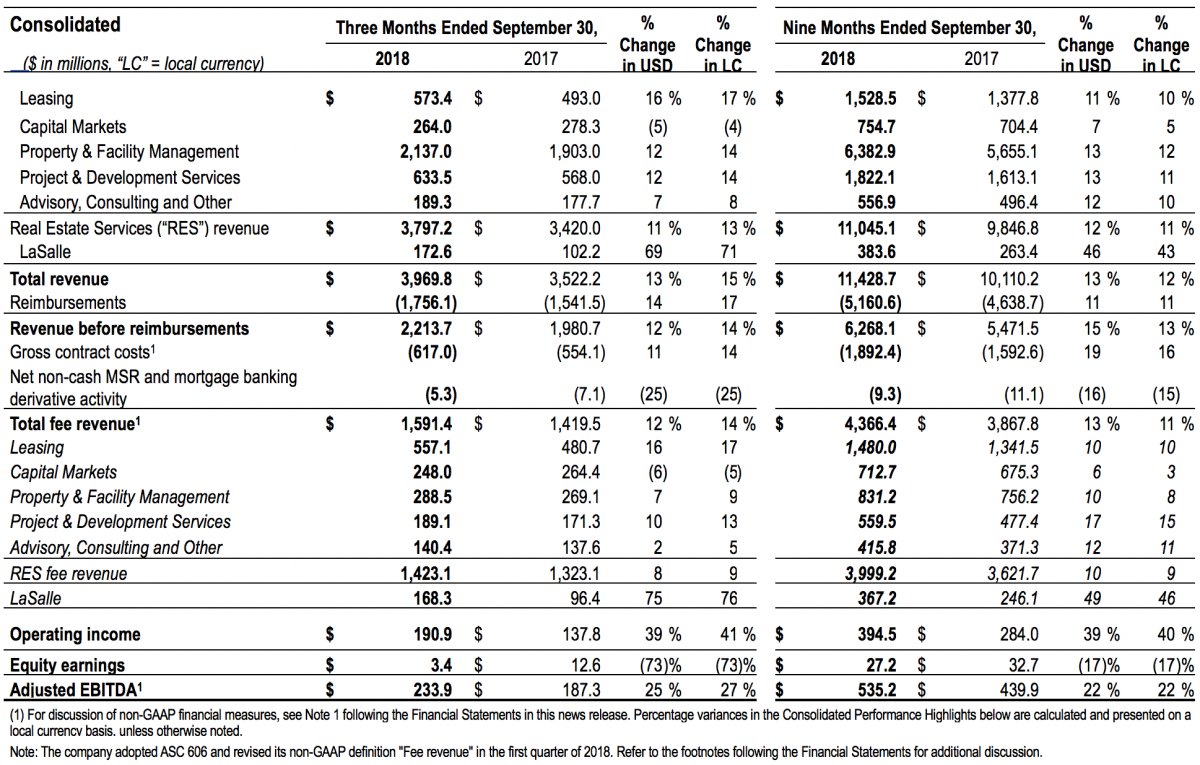
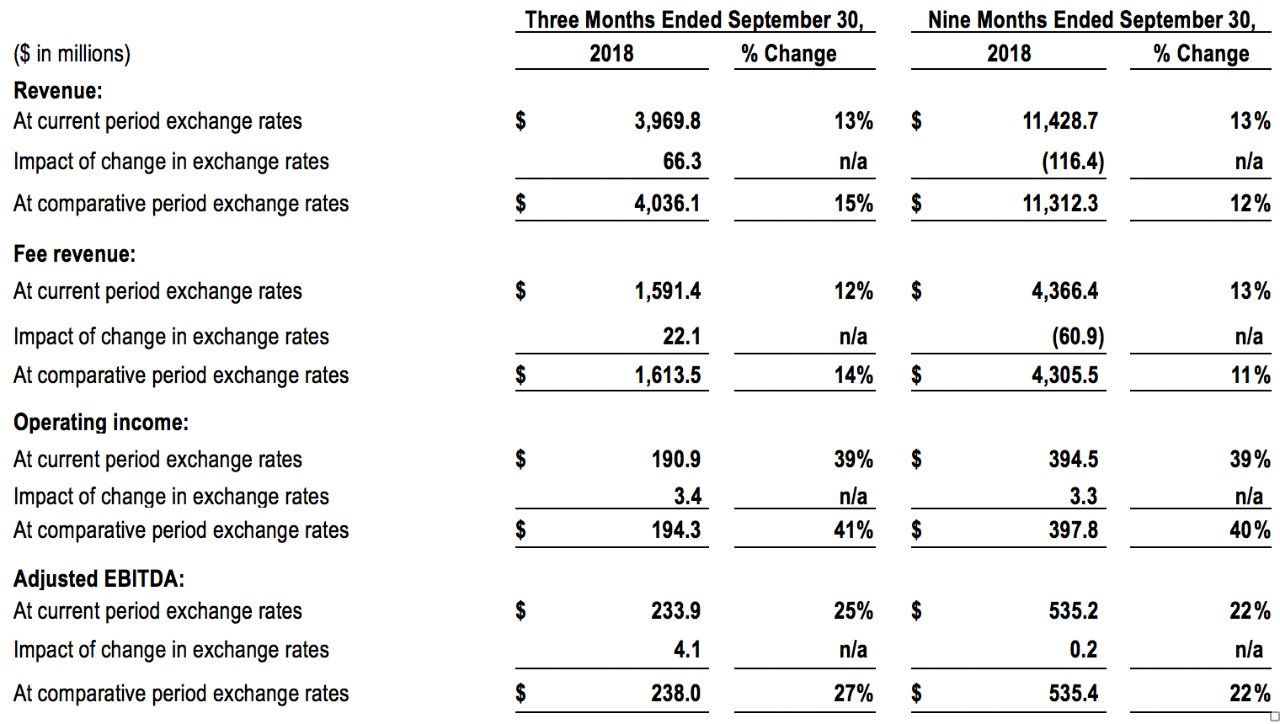
- Consolidated revenue and fee revenue increased 15 percent and 14 percent, respectively, compared with the prior year, with growth across all four segments
- Consolidated fee revenue increase in the RES service lines was led by Leasing, with notable contributions from Property & Facility Management and Project & Development Services. The decline in consolidated Capital Markets was driven by Asia Pacific. Geographically across the service lines, RES fee revenue growth was substantially driven by Americas, contributing 71 percent on a local currency basis, followed by EMEA (16 percent) and APAC (13 percent).
- LaSalle's significant revenue growth reflects near-record incentive fees earned on the disposition of real estate assets on behalf of clients, along with increased advisory fees in the current year.
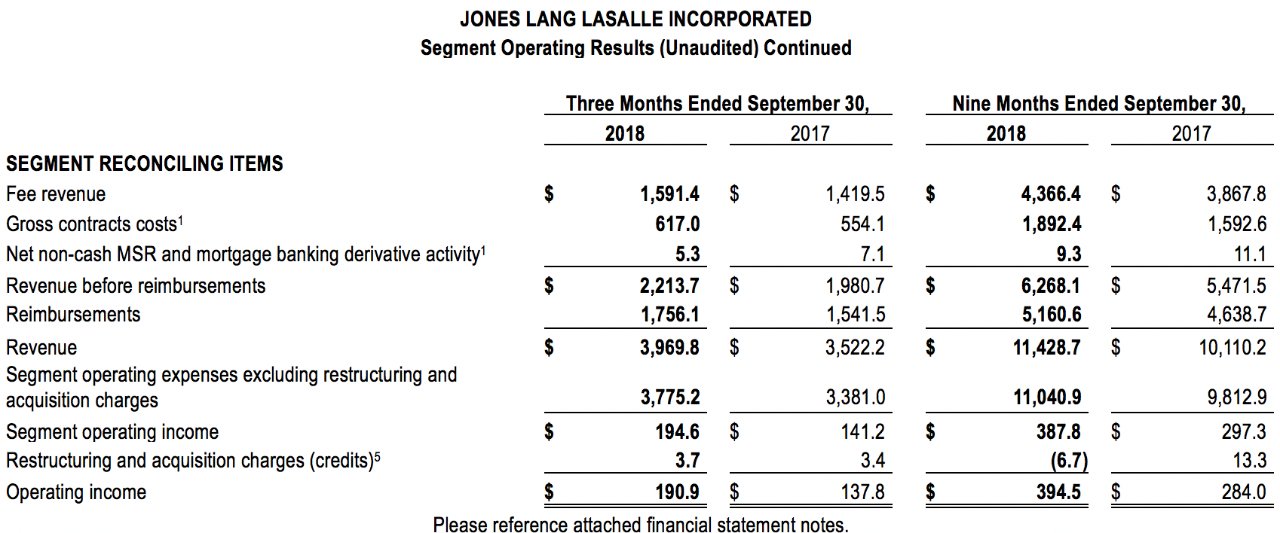
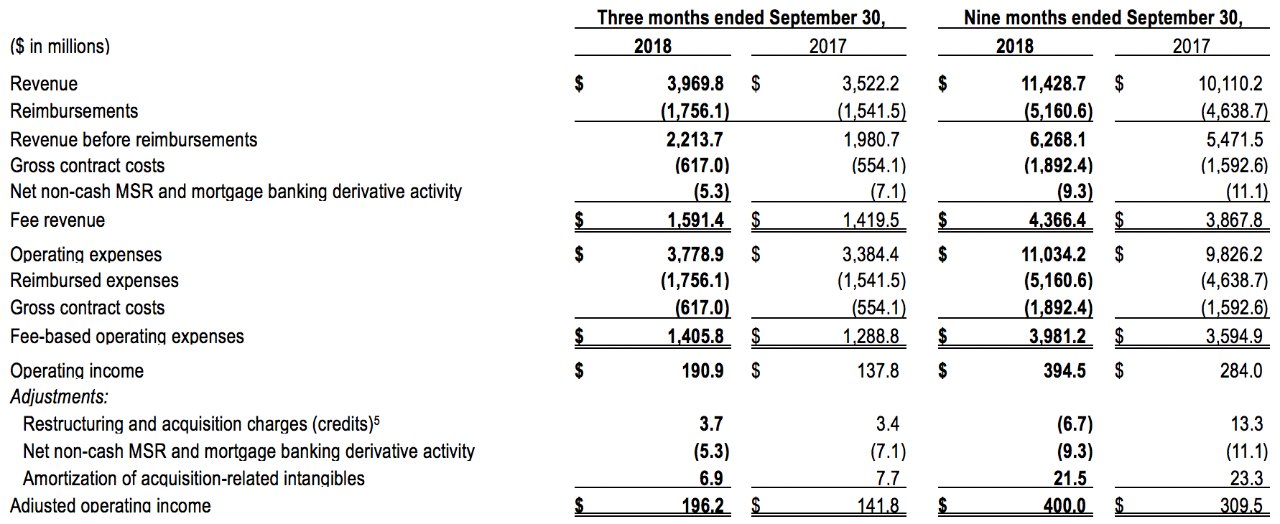
- Consolidated operating expenses excluding reimbursed expenses were $2.0 billion and consolidated fee-based operating expenses1 excluding restructuring and acquisition charges were $1.4 billion, increases of 12 percent and 11 percent, respectively, over last year.
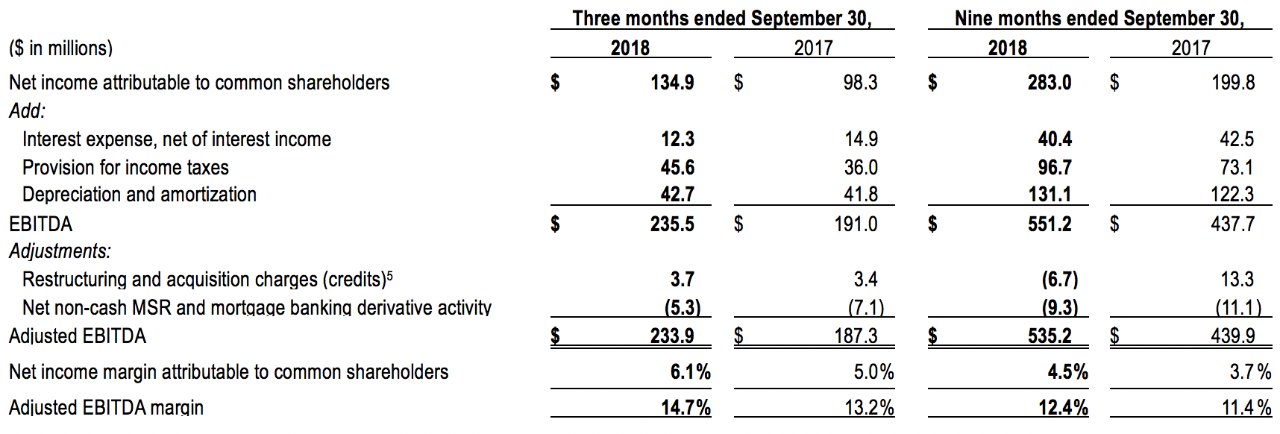
- Net income attributable to common shareholders was $134.9 million, compared with $98.3 million in the prior-year quarter, and adjusted EBITDA was $233.9 million, compared with $187.3 million in 2017. Adjusted EBITDA margin, calculated on a fee-revenue basis, was 14.7 percent in USD and local currency for the quarter, compared with 13.2 percent in 2017.
- The consolidated performance improvement reflects:
- Approximately 200 basis points of net operational expansion consisting of (i) 170 basis points from RES businesses and (ii) 120 basis points from LaSalle, enhancing the ability to fund (iii) 90 basis points of incremental investments in technology and people; partially offset by
- Approximately 50 basis points of headwind associated with the treatment of 2017 indirect expenses as part of the adoption of ASC Topic 606. Refer to Note 6 following the Financial Statements of this news release for additional information.
- Diluted earnings per share were $2.93, up from $2.15 in 2017; adjusted diluted earnings per share were $3.02, up from $2.21.
Balance Sheet and Net Interest Expense:
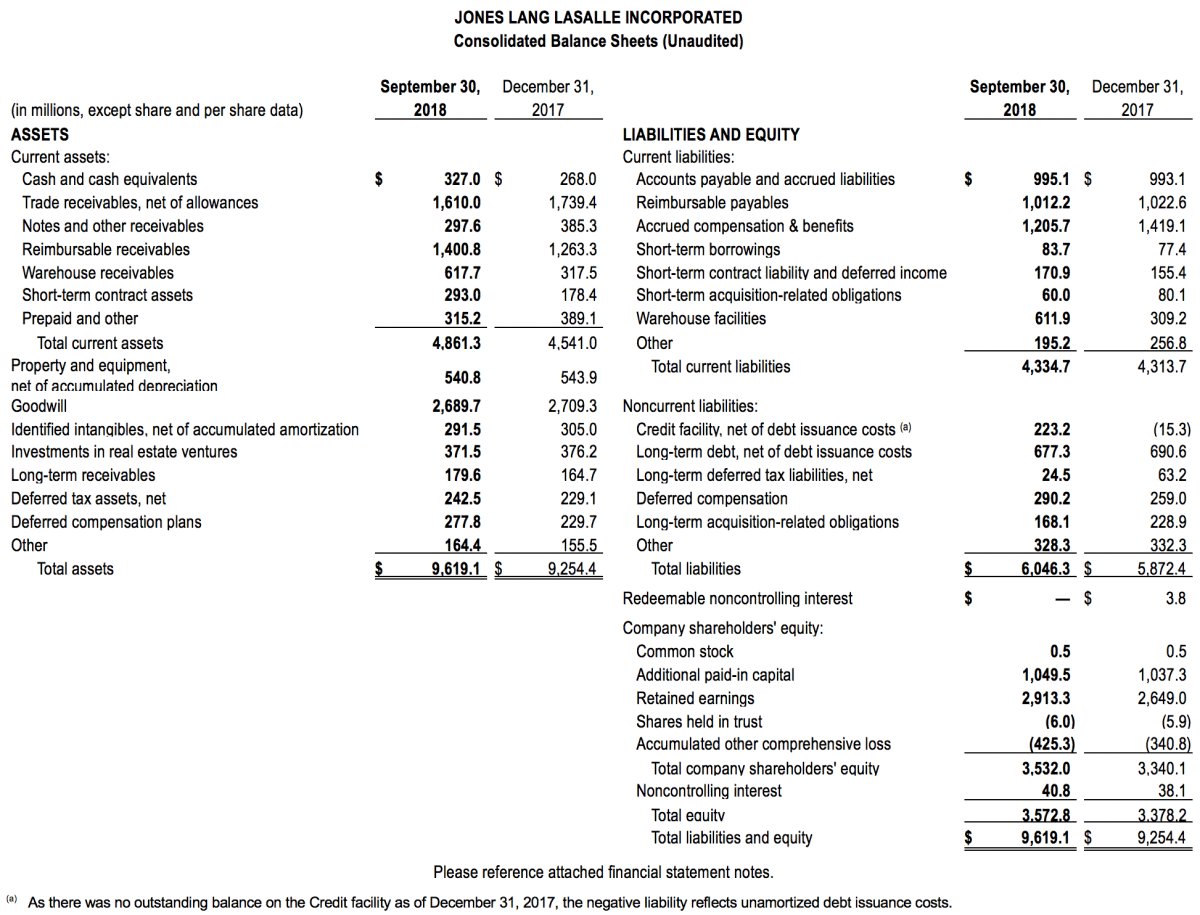
- Total net debt was $742.8 million as of September 30, 2018, representing decreases of $229.8 million and $270.0 million from June 30, 2018 and September 30, 2017, respectively. The decreases reflected strong cash generation from the company's trailing 12-month performance coupled with continued efforts to improve working capital management.
- Net interest expense was $12.3 million for the third quarter of 2018, a decrease from $14.9 million in the prior-year quarter. A decline in the outstanding average borrowings, partially offset by a higher effective interest rate on the Credit Facility, contributed to the decrease in net interest expense.
- The company's Board of Directors declared a dividend of $0.41 per share. The dividend payment will be made on December 14, 2018, to shareholders of record at the close of business on November 16, 2018. Total 2018 dividends of $0.82 per share increased from $0.72 per share in 2017.
Business Segment Performance Highlights
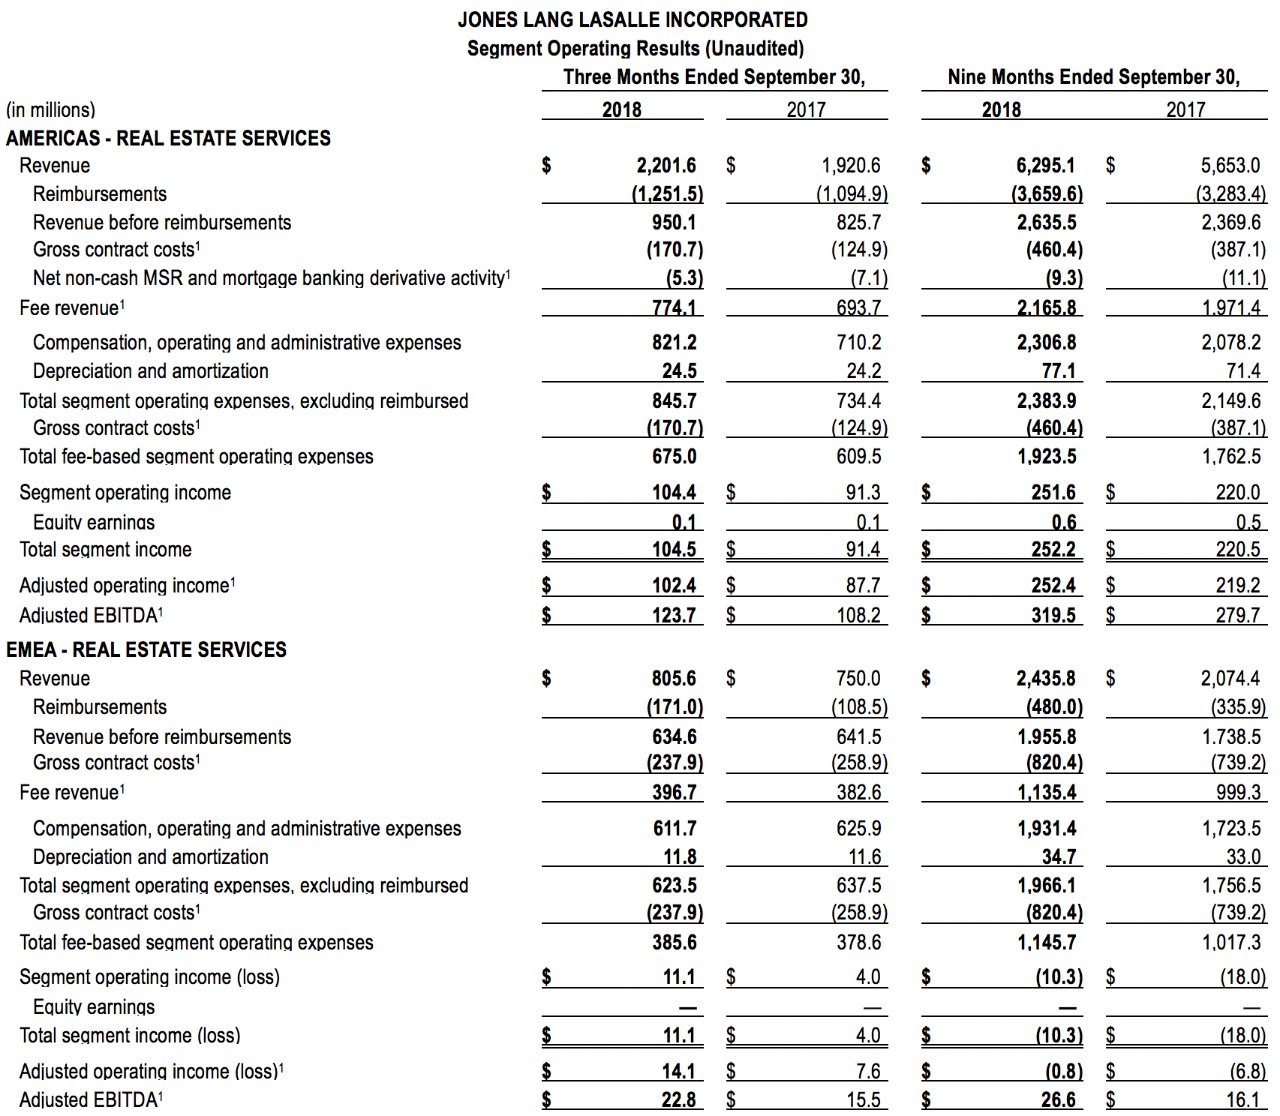
Americas Third-Quarter 2018 Performance Highlights:
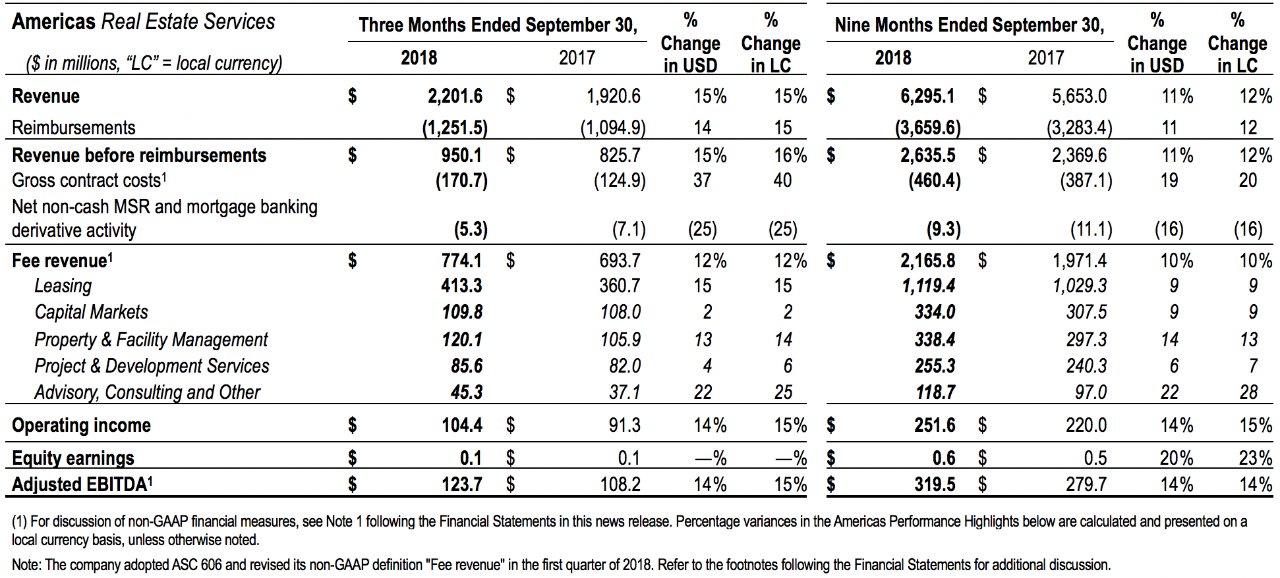
- Americas double-digit revenue and fee revenue increases reflect broad-based growth across all service lines. Leasing led year-over-year segment growth, specifically strong performance in the Mid-Atlantic, Southwest, Houston and Midwest U.S. markets. In addition, Property & Facility Management increased as a result of the ramp-up of recent wins and expansion of existing facilities management relationships with Corporate Solutions clients.
- Operating expenses, excluding reimbursed expenses, were $845.7 million, up 16 percent from 2017. Fee-based operating expenses, excluding restructuring and acquisition charges, were $675.0 million, up 11 percent over 2017. These increases correlate with the growth in revenue and also reflect increased investments in platform technology transformation programs.
- Operating income and adjusted EBITDA both increased 15 percent compared with the prior-year quarter. Adjusted EBITDA margin, calculated on a fee-revenue basis, was 16.0 percent in USD and local currency for the quarter, compared with 15.6 percent in 2017. The increase in profitability reflects the broad-based revenue growth, particularly from Leasing and Corporate Solutions, and yields from cost management initiatives, partially offset by the incremental investments noted above. In addition, margin comparability is impacted by the adoption of ASC 606; refer to Footnote 6 following the Financial Statements for additional information.
EMEA Third-Quarter 2018 Performance Highlights:
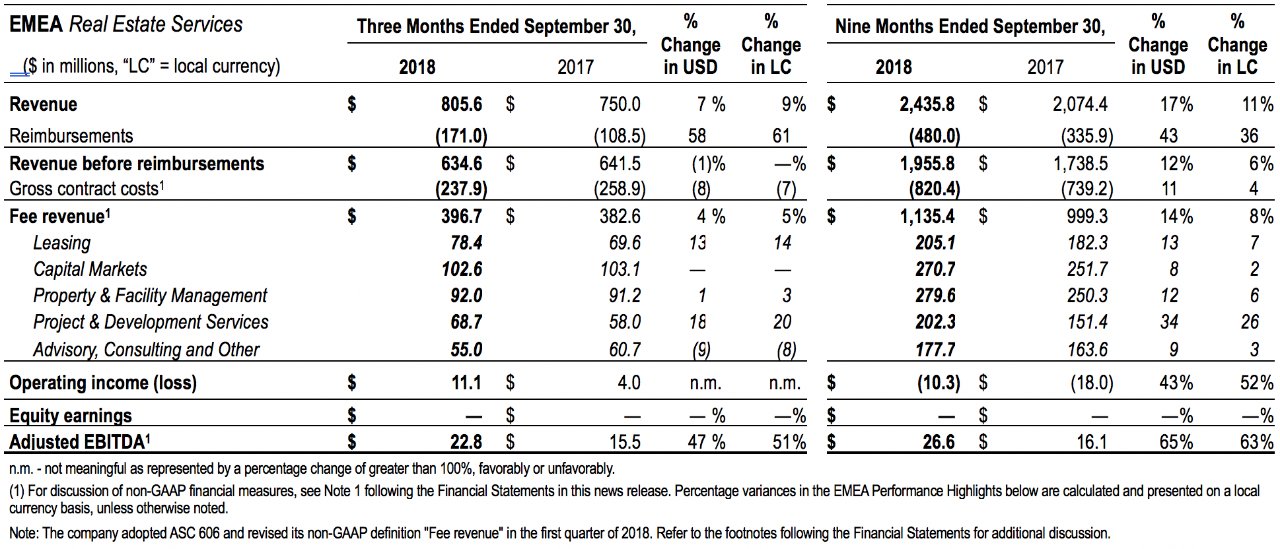
- EMEA revenue and fee revenue increased 9 percent and 5 percent, respectively, compared with the prior-year quarter. Fee revenue expansion was led by (i) Project & Development Services, driven by recent project wins and growth of the Tetris fit-out business in Continental Europe, and (ii) Leasing, primarily in Poland, Italy, and Germany. Capital Markets growth in certain markets, primarily France and Portugal, was offset by investment sales transactions in Finland that did not recur this year. Geographically across service lines, fee revenue expansion was most notable in France, Poland, and Portugal.
- Operating expenses, excluding reimbursed expenses, decreased 1 percent from 2017 to $623.5 million, and fee-based operating expenses, excluding restructuring and acquisition charges, increased 3 percent to $385.6 million, compared with the prior-year quarter. The change in expenses correlates with the change in revenue before reimbursements and fee revenue.
- Operating income increased by $7.1 million and adjusted EBITDA increased by $7.3 million from 2017. Adjusted EBITDA margin, calculated on a fee-revenue basis, was 5.7 percent in USD for the quarter (5.8 percent in local currency), compared with 4.0 percent last year. The improvement in profitability reflects the growth in revenue and reduction of Integral integration costs.
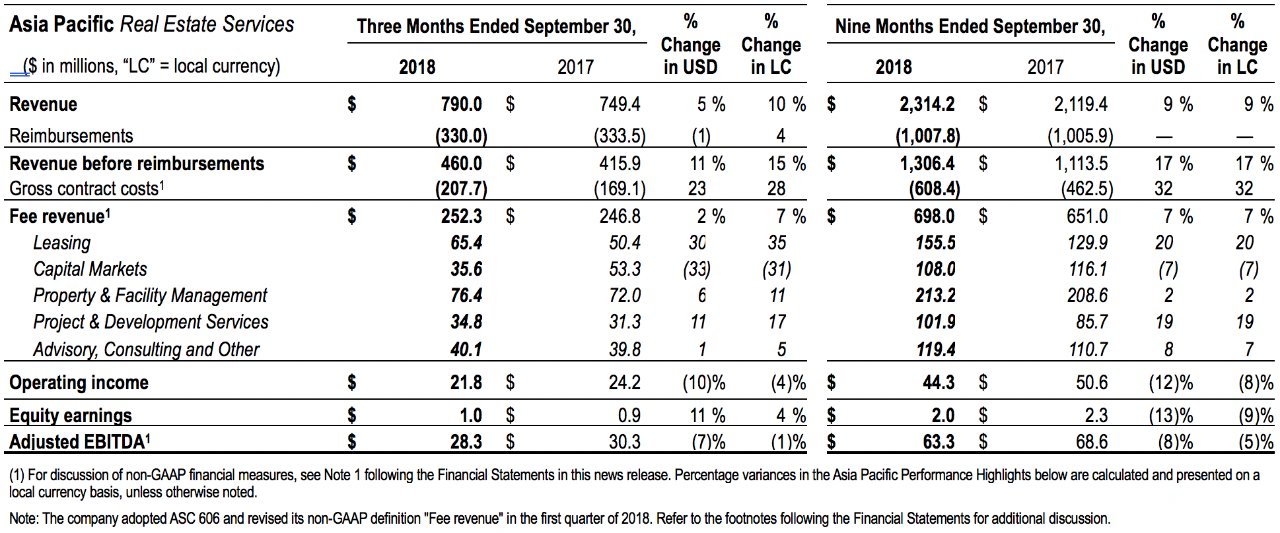
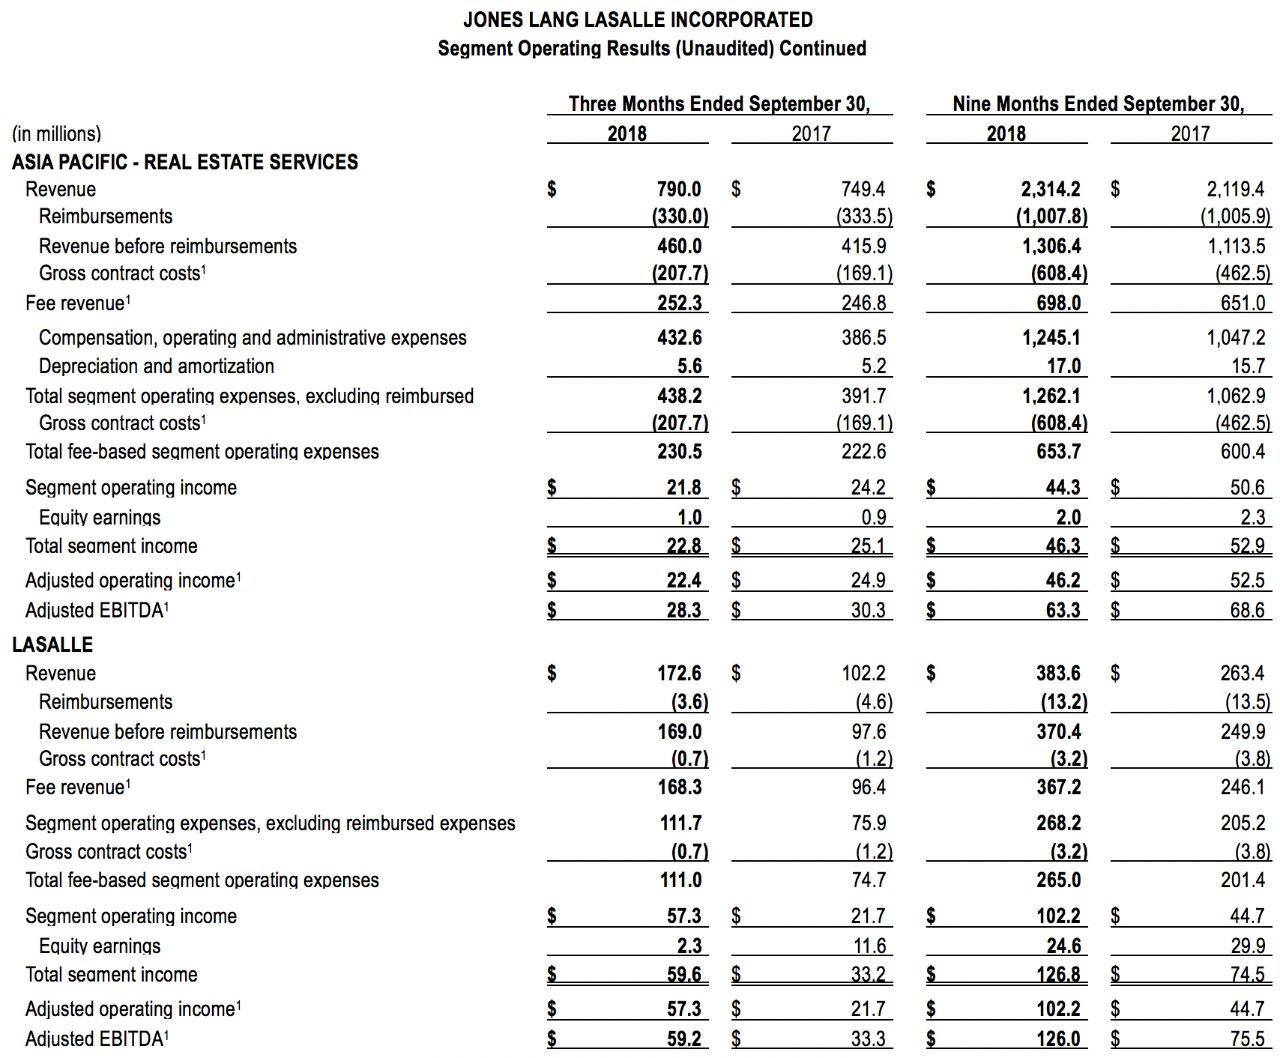
Asia Pacific Third-Quarter 2018 Performance Highlights:
- Asia Pacific revenue and fee revenue increased 10 percent and 7 percent, respectively, compared with 2017. Leasing led overall fee revenue growth, primarily the office sector in China and Australia. The decline in Capital Markets fee revenue was a result of 2018 deal timing against a tough comparable prior-year period, where growth was outsized at greater than 30 percent over 2016. Geographically across service lines, fee revenue expansion was most notable in Greater China.
- Operating expenses, excluding reimbursed expenses, were $438.2 million and fee-based operating expenses, excluding restructuring and acquisition charges, were $230.5 million, increases of 17 percent and 8 percent, respectively, over the prior year. The increase in expenses reflects revenue-related expense growth and increased investments in people.
- Operating income and adjusted EBITDA decreased slightly compared with 2017. Adjusted EBITDA margin, calculated on a fee-revenue basis, was 11.2 percent in USD for the quarter (11.4 percent in local currency), compared with 12.3 percent in 2017. Margin compression was primarily due to the net shift in service mix toward annuity-based revenue.
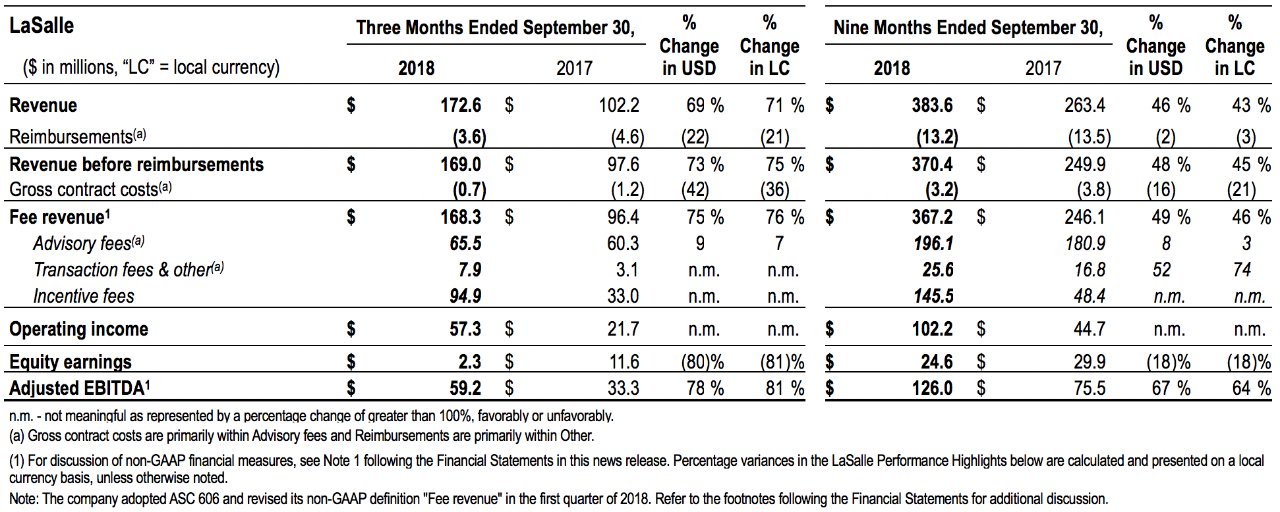
LaSalle Third-Quarter 2018 Performance Highlights:
- LaSalle revenue and fee revenue growth were driven by outstanding incentive fee performance from real estate dispositions on behalf of clients, predominantly in Asia Pacific. Continued expansion of private equity mandates drove solid advisory fee revenue growth.
- Equity earnings in the current year reflect gains on the sale of legacy investments substantially offset by net valuation decreases for investments in North America. Equity earnings in 2017 were driven by net valuation increases for investments in Europe and Asia.
- Operating expenses, excluding reimbursed expenses, were $111.7 million, up 48 percent from 2017. Fee-based operating expenses, excluding restructuring and acquisition charges, were $111.0 million, up 49 percent from 2017. The expense increases reflect higher variable compensation expense as a result of additional incentive fees.
- Operating income increased 168 percent and adjusted EBITDA increased 81 percent, both compared with last year. Adjusted EBITDA margin was 35.2 percent in USD for the quarter (35.4 percent in local currency), compared with 34.5 percent last year. The increase in margin is driven by higher incentive fees, partially offset by the decline in equity earnings.
- Assets under management (AUM) were $59.5 billion as of September 30, 2018, a decrease of 1 percent in USD (up 2 percent in local currency) from $59.9 billion as of June 30, 2018. The net decrease in AUM resulted from $2.2 billion of dispositions and withdrawals and $1.7 billion of foreign currency decreases, partially offset by $1.8 billion of acquisitions and $1.7 billion of net valuation increases. Private equity assets represented 88 percent of AUM as of September 30, 2018, compared with 80 percent as of September 30, 2017.
About JLL
JLL (NYSE: JLL) is a leading professional services firm that specializes in real estate and investment management. Our vision is to reimagine the world of real estate, creating rewarding opportunities and amazing spaces where people can achieve their ambitions. In doing so, we will build a better tomorrow for our clients, our people and our communities. JLL is a Fortune 500 company with operations in over 80 countries and a global workforce of nearly 88,000 as of September 30, 2018. JLL is the brand name, and a registered trademark, of Jones Lang LaSalle Incorporated. For further information, visit ir.jll.com.
Live Webcast
Management will offer a live webcast for shareholders, analysts and investment professionals on Tuesday, November 6, 2018, at 9:00 a.m. Eastern.
Please use the following webcast link:
https://engage.vevent.com/rt/joneslanglasalleincorporated~110618
Conference Call
Management will also conduct a conference call. If you are unable to join the live webcast and would like to participate in the teleconference, please dial into one of the following phone numbers five to ten minutes before the start time (the passcode will be required):
United States callers:
+1 844 231 9804
International callers:
+1 402 858 7998
Passcode:
9453978
Supplemental Information
Supplemental information regarding the third quarter 2018 earnings call has been posted to the Investor Relations section of JLL's website: ir.jll.com.
Audio Replay
An audio replay will be available for download or stream. Information and the link can be found on JLL's website: ir.jll.com.
If you have any questions, please contact JLL Investor Relations: JLLInvestorRelations@am.jll.com.
Cautionary Note Regarding Forward-Looking Statements
Statements in this news release regarding, among other things, future financial results and performance, achievements, dividends, plans and objectives may be considered forward-looking statements within the meaning of the Private Securities Litigation Reform Act of 1995. Such statements involve known and unknown risks, uncertainties, and other factors which may cause the company's actual results, performance, achievements, dividends, plans and objectives to be materially different from those expressed or implied by such forward-looking statements. For additional information concerning risks, uncertainties, and other factors that could cause actual results to differ materially from those anticipated in forward-looking statements, and risks to the company's business in general, please refer to those factors discussed under “Business,” “Management’s Discussion and Analysis of Financial Condition and Results of Operations,” “Quantitative and Qualitative Disclosures about Market Risk,” and elsewhere in the company's Annual Report on Form 10-K for the year ended December 31, 2017, Quarterly Reports on Form 10-Q for the quarters ended March 31, 2018, and June 30, 2018, and in other reports filed with the Securities and Exchange Commission. Any forward-looking statements speak only as of the date of this release, and except to the extent required by applicable securities laws, management expressly disclaims any obligation or undertaking to publicly update or revise any forward-looking statements contained herein to reflect any change in expectations or results, or any change in events.
JONES LANG LASALLE INCORPORATED
Financial Statement Notes
1. Management uses certain non-GAAP financial measures to develop budgets and forecasts, measure and reward performance against those budgets and forecasts, and enhance comparability to prior periods. These measures are believed to be useful to investors and other external stakeholders as supplemental measures of core operating performance and include the following:
(i) Fee revenue and Fee-based operating expenses,
(ii) Adjusted operating income,
(iii) Adjusted EBITDA and Adjusted EBITDA margin,
(iv) Adjusted net income attributable to common shareholders and Adjusted diluted earnings per share, and
(v) Percentage changes against prior periods, presented on a local currency basis.
However, non-GAAP financial measures should not be considered alternatives to measures determined in accordance with U.S. generally accepted accounting principles (“GAAP”). Any measure that eliminates components of a company’s capital structure, cost of operations or investment, or other results has limitations as a performance measure. In light of these limitations, management also considers GAAP financial measures and does not rely solely on non-GAAP financial measures. Because the company's non-GAAP financial measures are not calculated in accordance with GAAP, they may not be comparable to similarly titled measures used by other companies.
Adjustments to GAAP Financial Measures Used to Calculate non-GAAP Financial Measures
Gross Contract Costs represent certain costs associated with client-dedicated employees and third-party vendors and subcontractors and are indirectly reimbursed through the management fee we receive. These costs are presented on a gross basis in Operating expenses with the corresponding management fee in Revenue before reimbursements. However, as we generally earn little to no margin on such costs, excluding gross contract costs from both Fee revenue and Fee-based operating expenses more accurately reflects how the company manages its expense base and operating margins and also enables a more consistent performance assessment across a portfolio of contracts with varying payment terms and structures, including those with direct versus indirect reimbursement of such costs.
Net Non-Cash Mortgage Servicing Rights ("MSR") and Mortgage Banking Derivative Activity consists of the balances presented within Revenue composed of (i) derivative gains/losses resulting from mortgage banking loan commitment and warehousing activity and (ii) gains recognized from the retention of MSR upon origination and sale of mortgage loans, offset by (iii) amortization of MSR intangible assets over the period that net servicing income is projected to be received. Non-cash derivative gains/losses resulting from mortgage banking loan commitment and warehousing activity are calculated as the estimated fair value of loan commitments and subsequent changes thereof, primarily represented by the estimated net cash flows associated with future servicing rights. MSR gains and corresponding MSR intangible assets are calculated as the present value of estimated cash flows over the estimated mortgage servicing periods. The above activity is reported entirely within Revenue of the Capital Markets business line of the Americas segment. Excluding net non-cash MSR and mortgage banking derivative activity reflects how the company manages and evaluates performance because the excluded activity is non-cash in nature.
Restructuring and Acquisition Charges primarily consist of: (i) severance and employment-related charges, including those related to external service providers, incurred in conjunction with a structural business shift, which can be represented by a notable change in headcount, change in leadership or transformation of business processes; (ii) acquisition and integration-related charges, including non-cash fair value adjustments to assets and liabilities recorded in purchase accounting such as earn-out liabilities and intangible assets; and (iii) lease exit charges. Such activity is excluded as the amounts are generally either non-cash in nature or the anticipated benefits from the expenditures would not likely be fully realized until future periods. Restructuring and acquisition charges are excluded from segment operating results and therefore not a line item in the segments’ reconciliation from operating income to adjusted operating income and Adjusted EBITDA.
Amortization of Acquisition-Related Intangibles, primarily composed of the estimated fair value ascribed at closing of an acquisition to assets such as acquired management contracts, customer backlog and trade name, is more notable following the company's increase in acquisition activity in recent years. Such activity is excluded as the change in period-over-period activity is generally the result of longer-term strategic decisions and therefore not necessarily indicative of core operating results. At the segment reporting level, this is the only reconciling difference between operating income and adjusted operating income, except for the Americas segment, where Net non-cash MSR and mortgage banking derivative activity is also excluded.
Reconciliation of Non-GAAP Financial Measures
Below are reconciliations of (i) Revenue to Fee revenue, (ii) Operating expenses to Fee-based operating expenses, and (iii) Operating income to Adjusted operating income:
Adjusted EBITDA attributable to common shareholders ("Adjusted EBITDA") represents EBITDA attributable to common shareholders (“EBITDA”) further adjusted for certain items management does not consider directly indicative of the company's ongoing performance in the context of certain performance measurements. Below is (i) a reconciliation of Net income attributable to common shareholders to EBITDA and Adjusted EBITDA, (ii) the Net income margin attributable to common shareholders (against Revenue before reimbursements), and (iii) the Adjusted EBITDA margin (presented on a local currency and on a fee-revenue basis):
Below is the (i) reconciliation to adjusted net income and (ii) components of adjusted diluted earnings per share:
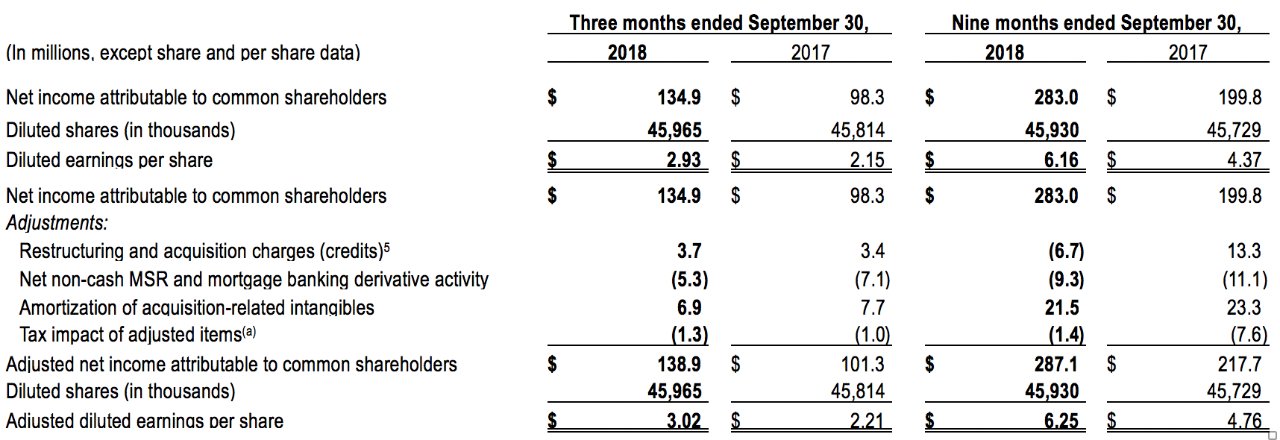
(a) In 2018 and the second and third quarters of 2017, the tax impact of adjusted items was calculated using the consolidated effective tax rate as this approximates the tax impact of adjusted items calculated using applicable statutory tax rates. The tax impact of adjusted items for the first quarter of 2017 was calculated using the applicable statutory rates.
Operating Results - Local Currency
In discussing operating results, the company reports Adjusted EBITDA margins and refers to percentage changes in local currency, unless otherwise noted. Amounts presented on a local currency basis are calculated by translating the current period results of foreign operations to U.S. dollars using the foreign currency exchange rates from the comparative period. Management believes this methodology provides a framework for assessing performance and operations excluding the effect of foreign currency fluctuations. The following table reflects the reconciliation to local currency amounts for consolidated (i) revenue, (ii) fee revenue, (iii) operating income, and (iv) Adjusted EBITDA:
2. The company considers Annuity Revenue to be (i) 100% of Property & Facility Management, (ii) 50% of Leasing, (iii) 50% of Project & Development Services, and (iv) 50% of Advisory, Consulting and Other Revenue, as well as (v) LaSalle Advisory Fees. For purposes of distinguishing organic from acquisition-related contributions, the population of acquisitions includes those completed in the trailing four quarters inclusive of the current reported quarter.
3. Each geographic region offers the company's full range of RES businesses consisting primarily of (i) tenant representation and agency leasing, (ii) capital markets, (iii) property management and facilities management, (iv) project and development services, and (v) advisory, consulting and valuations services. LaSalle provides investment management services to institutional investors and high-net-worth individuals.
4. Effective January 1, 2018, the company adopted ASC Topic 606, Revenue from Contracts with Customers ("ASC 606"), on a retrospective basis. The adoption of ASC 606, together with the continued changes in the company's business mix, prompted the company to expand the types of costs excluded from the calculation of the non-GAAP measure "Fee revenue." Specifically, the drivers were (i) the increase in compensation and benefits associated with client-dedicated personnel presented on a gross basis and (ii) the expansion of annuity businesses engaged to provide outsourced services to clients.
The most notable change is the inclusion of compensation and benefits associated with client-dedicated employees in gross contract costs. In addition, the previous calculation of gross contract costs applied to only Project & Development Services and Property & Facility Management but now applies to all service lines and businesses. The largest impacts of the change to JLL's definition of fee revenue are within Project & Development Services and Property & Facility Management.
Additional materials were provided in the company’s April 2018 podcast, available on the company’s website (ir.jll.com) and furnished to the Securities and Exchange Commission (“SEC”) on Form 8-K dated April 30, 2018. For additional commentary on the adoption of ASC 606 and the change to the fee revenue calculation, refer to the company’s Form 10-Q for the periods ended September 30, 2018, to be filed with the SEC in the near future.
5. Restructuring and acquisition charges are excluded from the company's measure of segment operating results, although they are included for consolidated Operating income calculated in accordance with GAAP. For purposes of segment operating results, the allocation of restructuring and acquisition charges to the segments is not a component of management’s assessment of segment performance.
Restructuring and acquisition charges were $3.7 million and $3.4 million for the third quarter of 2018 and 2017, respectively. Charges in the third quarter of 2018 reflected (a) $6.1 million of severance and other employment-related charges incurred with respect to headcount reductions or other activities considered to represent structural changes to local, regional, and/or global business operations and (b) $0.3 million of costs incurred for pre-acquisition due diligence and post-acquisition integration activities, partially offset by $2.7 million of net non-cash fair value adjustments relating to a net decrease to earn-out liabilities that arose from prior period acquisition activity. Comparatively, charges in 2017 included $4.2 million of severance and other employment-related charges, partially offset by immaterial amounts for pre-acquisition due diligence and post-acquisition integration activities and net non-cash fair value adjustments relating to a net decrease to earn-out liabilities that arose from prior period acquisition activity.
6. The recast of the third quarter 2017, reflecting the adoption of ASC 606, resulted in the recognition of $34.8 million of incremental fee revenue and $15.3 million of direct expenses (predominantly commission expense), nearly all in Americas. This reflects a 56.0% operating margin on the incremental recast fee revenue and drives the 50 basis point headwind previously noted. However, indirect expenses such as variable compensation were not permitted by U.S. GAAP to be modified in the recast of prior periods, despite the recognition of incremental fee revenue.
7. The consolidated statements of cash flows are presented in summarized form. For complete consolidated statements of cash flows, please refer to the company's Quarterly Report on Form 10-Q for the nine months ended September 30, 2018, to be filed with the SEC in the near future.
8. EMEA: Europe, Middle East and Africa. Greater China: China, Hong Kong, Macau and Taiwan. Southeast Asia: Singapore, Indonesia, Philippines, Thailand and Vietnam. MENA: Middle East and North Africa. Benelux: Belgium, the Netherlands and Luxembourg.
9. As of September 30, 2018, LaSalle had $59.5 billion of real estate assets under management with approximately $7.5 billion available for investment (“dry powder”) contemplating committed capital and available borrowing capacity at traditional leverage levels. Assets under management were composed of $34.2 billion invested in separate accounts, $18.0 billion invested in fund management vehicles and $7.3 billion invested in public securities. The geographic distribution of separate accounts and fund management investments was $20.7 billion in North America, $16.6 billion in the UK, $8.4 billion in Asia Pacific and $6.5 billion in continental Europe. Assets under management data for separate accounts and fund management amounts are reported on a one-quarter lag. LaSalle raised $2.1 billion in capital for the quarter ended September 30, 2018.
Contact: |
Grace Chang |
Title: |
Managing Director, Investor Relations |
Phone: |
+1 312 252 8943 |
JLL (NYSE: JLL) is a leading professional services firm that specializes in real estate and investment management. Our vision is to reimagine the world of real estate, creating rewarding opportunities and amazing spaces where people can achieve their ambitions. In doing so, we will build a better tomorrow for our clients, our people and our communities. JLL is a Fortune 500 company with operations in over 80 countries and a global workforce of 88,000 as of September 30, 2018. JLL is the brand name, and a registered trademark, of Jones Lang LaSalle Incorporated. For further information, visit jll.com